
How Omnichannel WhatsApp & Voice Ticketing Boosts CSAT by 45%
Explore how unifying WhatsApp Business API with embedded softphone calls under a single customer timeline reduces ticket backlog and increases CSAT scores.
Read articleFCR, AHT, CSAT, reopen rate, per-status dwell time and response aging — with the exact formulas, realistic benchmarks, and the measurement mistakes that quietly make each metric dishonest.
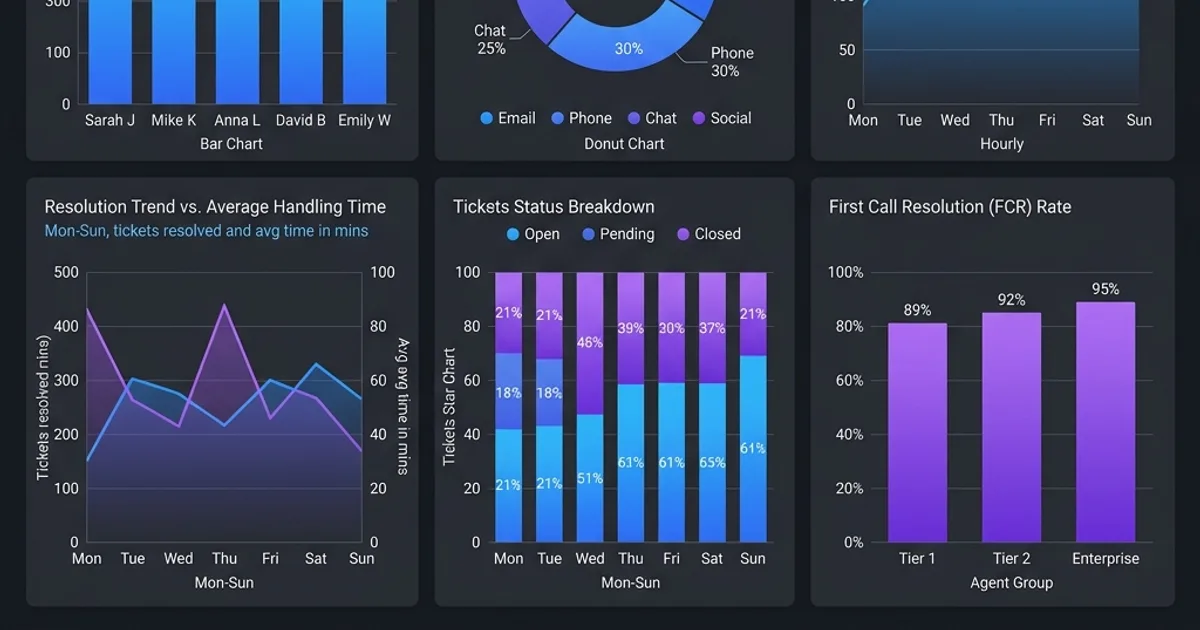
Most support dashboards measure what is easy to count rather than what predicts churn. Ticket volume is easy. Average handle time is easy. Neither tells you whether customers are getting help.
This is a practical guide to the metrics worth tracking in 2026, how to calculate each one correctly, and — more importantly — the measurement mistakes that make them lie.
Definition: the share of tickets resolved in a single interaction, with no follow-up.
Formula: FCR = (tickets resolved on first contact ÷ total tickets) × 100
Benchmark: 70–75% is strong for ecommerce and D2C support.
The mistake: counting a ticket as "resolved" the moment an agent closes it. If the customer replies two days later reopening the thread, that was never a first-contact resolution. FCR is only honest if your reopen window is at least 72 hours and reopens retroactively decrement it. Platforms that count closures rather than resolutions systematically overstate FCR.
Formula: AHT = (talk time + hold time + after-call work) ÷ number of contacts
AHT is the most commonly gamed metric in support. Optimise for it in isolation and agents close tickets prematurely, which raises reopen rates and destroys FCR. Never review AHT without FCR and CSAT beside it. A falling AHT with a rising reopen rate is not an efficiency gain; it is a quality collapse in progress.
The legitimate way to reduce AHT is to remove work from the agent: order context in the ticket window, AI-drafted replies, and canned responses for repeat questions.
These answer different questions and should never be merged.
| Metric | What it measures | Typical target |
|---|---|---|
| First Response Time | How long before a human acknowledges | < 1 hour (email), < 60s (chat/voice) |
| Resolution Time (TAT) | How long until the issue is actually fixed | Varies by category |
The mistake: counting parked time against resolution TAT. A ticket waiting on a courier or a customer reply is not time your team is failing to work — including it makes every logistics-dependent category look broken. Subtract parked intervals, and measure TAT to the actual close time rather than to "now".
Formula: CSAT = (positive responses ÷ total responses) × 100
The mistake: surveying everyone. Response rates on all-ticket surveys run 5–15%, and the responders skew to the extremes — delighted and furious — which makes the mean meaningless. Sample deliberately, and segment by category and channel. A single blended CSAT number hides that your voice support is excellent and your email backlog is not.
Formula: Reopen rate = (tickets reopened ÷ tickets closed) × 100
Benchmark: under 10%.
Reopen rate is the most under-used metric in support, and arguably the most honest. It cannot be gamed by closing tickets faster — closing them faster makes it worse. Rising reopens are the earliest signal that AHT pressure is damaging quality.
Where do tickets actually sit? Not "how long was this open," but how many hours it spent with each team.
A ticket open for six days might have spent 20 minutes with support and five days with logistics. Aggregate TAT hides this completely; per-status dwell time makes the real bottleneck obvious — and it is very often not the support team.
Track: hours in each status, most recent entry into each status, and re-entries. A ticket bouncing between two departments three times is a routing problem, not an effort problem.
Not a historical metric — an operational one. How many currently-open tickets have had no response in 1–3 days? 3–7? Over 7?
Historical averages tell you how last month went. Response aging tells you which customers are being forgotten right now, and it is the single most useful number on a support lead's screen.
Pair it with who responded last. If the customer spoke last, the ball is in your court. If an agent spoke last, you are waiting on them. Two very different queues that most dashboards merge into one.
Pick a small set and read them together:
A dashboard with forty metrics gets ignored. Six metrics that contradict each other usefully get acted on.
Most of these are impossible to compute accurately without the right event data. Specifically, you need:
If your platform only stores the current state of a ticket, every metric above is an approximation.
Wevyn tracks per-status dwell time, park-excluded TAT, last-responder attribution, and response aging as first-class data. See the reporting suite →
AI & Customer Experience at Wevyn. Building autonomous AI voice agents and cloud dialers for customer service operations.
Explore how unifying WhatsApp Business API with embedded softphone calls under a single customer timeline reduces ticket backlog and increases CSAT scores.
Read article
How Canberra enterprises, government agencies, and Australian BPOs leverage AI support CRMs with native WebRTC cloud dialers to meet strict compliance and eliminate hold times.
Read article
Discover why traditional CRMs with third-party CTI plugins fail modern support teams and how native WebRTC cloud dialers with AI voice agents reduce AHT by 40%.
Read articleWe use cookies to understand how visitors use wevyn.ai — which pages, from where — so we can improve the site. Nothing loads until you say yes. Privacy policy